Quick answer
Buying beats renting when you stay long enough to recover buying and selling costs and comparable rent is higher than the break-even rent. Renting wins for shorter stays, in high price-to-rent markets, or when mortgage rates are high and you invest the money you would have put into a deposit. Most people need 4 to 10 years for buying to pay off.
How the rent vs buy calculator works
Most rent vs buy comparisons stop at one question: is the mortgage payment lower than the rent? That is the wrong test. A fair rent vs buy calculator compares two complete financial paths over the same period and asks which one leaves you with more wealth at the end. That is exactly what this tool does.
The calculator simulates every month of your stay. On the buying path, you pay a down payment (deposit) and one-off buying costs such as stamp duty, transfer tax, legal and lender fees. Each month you pay the mortgage, property tax, maintenance, insurance and any HOA, strata or service charges. Your home grows in value at the appreciation rate you choose, and when you leave, it is sold and selling costs are deducted.
On the renting path, you pay rent (which rises each year) plus renter costs like contents insurance. Crucially, the renter does not leave the deposit sitting idle: it is invested on day one, and every month that renting is cheaper than owning, the difference is invested too. If owning becomes cheaper later — because rents rise while your mortgage stays fixed — the owner invests the difference instead. This is how the calculator accounts for the opportunity cost of a down payment.
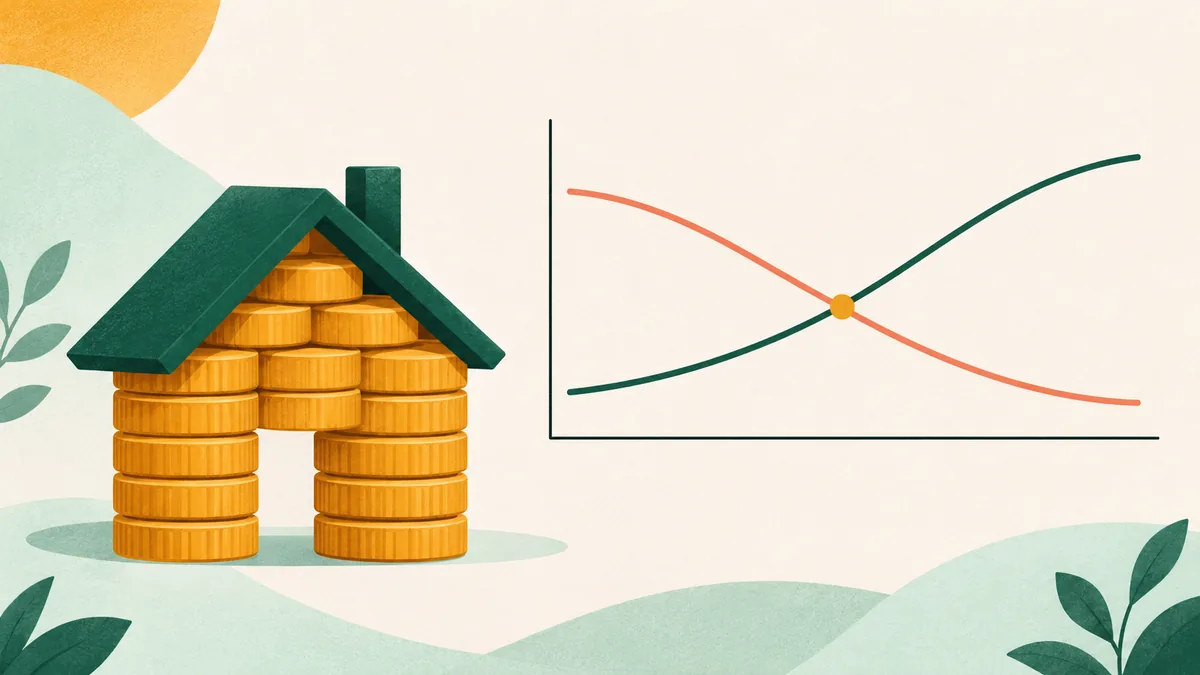
The result is two net-worth lines. Where the buying line crosses above the renting line is your break-even year. The full assumptions and formulas are documented on our methodology page.
How to use it in five steps
- Choose your market. Selecting a country or city loads its currency and typical costs — for example the 4% Dubai Land Department fee in the UAE, Stamp Duty in the UK, or high property taxes in parts of the US.
- Set how long you will stay. This is the most important input. Transaction costs are paid once, so the longer you stay, the more years you have to spread them over.
- Enter a real price and a real rent. Use a home you would actually buy and the rent for a genuinely comparable home — same size, area and quality.
- Check the mortgage rate and deposit. Use a rate you can actually get today, not the best advertised rate.
- Stress-test the growth assumptions. Try home price growth one point lower and the investment return one point higher. If the verdict flips, the decision is close and non-financial factors should decide it.
How to read your results
The verdict shows which path leaves you wealthier after your chosen number of years, and by how much, in today’s currency units (not adjusted for inflation). Break-even year is the first year in which buying overtakes renting. If it says 30+ years, renting wins on these assumptions for any realistic stay.
Break-even rent is the most practical number on the page. It is the monthly rent at which the two paths finish level. If you can rent a comparable home for less, rent. If comparable homes rent for more, buying is likely the better deal. It turns a complex model into a figure you can compare directly with listings.
The 5% rule check gives a quick sanity test popularised by Canadian portfolio manager Ben Felix: multiply the home price by 5% and divide by 12 to estimate the monthly unrecoverable cost of owning. The calculator also shows a personalised percentage based on your tax, maintenance, rate and return inputs. Learn more in our guide to the 5% rule.
The price-to-rent ratio divides the home price by a year of rent. Ratios above roughly 20 usually lean towards renting, and below roughly 15 lean towards buying, though local rates and costs matter. See what the price-to-rent ratio tells you.
The factors that decide rent vs buy
| Factor | Favours buying when… | Favours renting when… |
|---|---|---|
| Time in the home | You stay 7+ years | You may move within 3–5 years |
| Price-to-rent ratio | Below ~15 (high rental yields) | Above ~20 (low rental yields) |
| Mortgage rate | Low relative to rental yield and expected growth | High relative to rental yield |
| Transaction costs | Low (e.g. New Zealand, Ireland) | High (e.g. Germany, Spain, Dubai, India) |
| Investment discipline | You would not invest the difference | You reliably invest your savings |
| Rent growth | Rents rise fast while your payment is fixed | Rents are controlled or flat |
No single factor decides it. A city with a high price-to-rent ratio can still favour buying if you stay 20 years, and a cheap market can favour renting if transaction costs are steep and you move often. That is why running the full model matters more than any rule of thumb.
Rent vs buy across the world’s top markets
The table below runs the calculator with the default assumptions for every market over a 10-year stay. It shows how differently the rent-or-buy question plays out around the world — from Dubai, where high rental yields favour buying, to cities like Toronto, Sydney and New York, where low yields often favour renting and investing.