The Opportunity Cost of a Down Payment, Explained With Real Numbers
Short answer
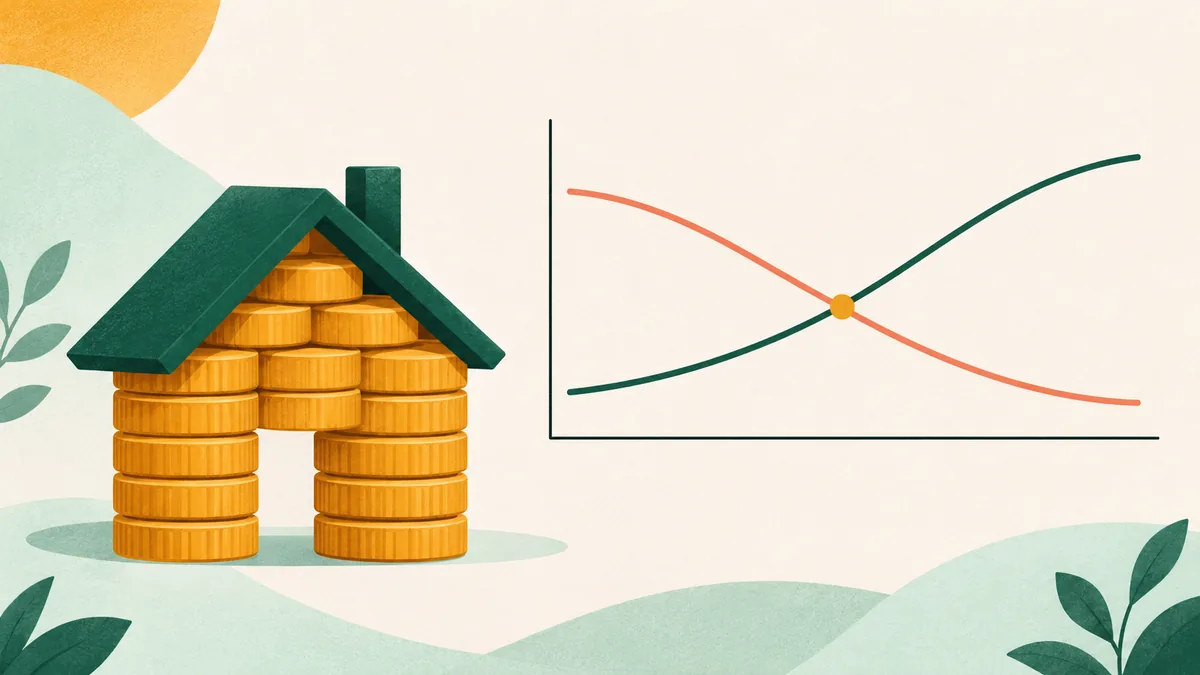
The opportunity cost of a down payment is the return that money would have earned if invested instead of tied up in a home. It grows with your expected investment return and your horizon. A bigger deposit makes sense when your mortgage rate is higher than your realistic after-tax investment return; when it is lower, a smaller deposit usually leaves you wealthier.
Key takeaways
- Count the deposit plus buying costs as the cash that could have been invested, not just the deposit.
- Over 10 years at 10%, ₹21.6 lakh grows to about ₹56 lakh; that is the bar an Indian home has to clear.
- Rule of thumb: put more down when the mortgage rate exceeds your after-tax return; put less down when it does not.
- Liquidity, mortgage insurance and lender pricing tiers can override the pure maths.
What is the opportunity cost of a down payment?
The opportunity cost of down payment money is the investment return you give up by putting cash into a home instead of a portfolio. If you put $96,600 into a house and that money could have earned 7% a year elsewhere, the opportunity cost after 10 years is roughly $93,400 of forgone growth. A home only beats renting if its appreciation, equity build-up and rent savings outrun that number.
Opportunity cost is the reason buying is not automatically “building wealth” while renting is “throwing money away.” The renter who does not buy keeps the deposit and can invest it. Every serious rent vs buy model, including ours, credits the renter with that invested cash on day one. You can see the effect directly in the rent and invest vs buy calculator.
How do you calculate deposit opportunity cost?
Start with the cash that leaves your account on completion day:
- Upfront cash = down payment + buying costs (transfer tax or stamp duty, legal, valuation, lender and agent fees).
Then project what it would have grown to:
- Future value = upfront cash × (1 + r)ⁿ, where r is your expected after-tax annual return and n is years.
- Opportunity cost = future value − upfront cash.
That is the static version. A full comparison also tracks the monthly difference in housing costs. When owning costs more each month than renting, the renter invests the gap too; when owning becomes cheaper, the owner invests the gap. Our methodology page explains how the calculator does this month by month.
Worked examples across three very different markets
These examples use the default assumptions in our calculator for each market over a 10-year horizon. They are illustrative, not forecasts.
India: high returns make the bar high
The India default is a ₹80 lakh home with 20% down, 7% buying costs (stamp duty and registration), an 8.5% home loan over 20 years, 6% price growth and a 10% after-tax investment return.
- Upfront cash: ₹16 lakh deposit + ₹5.6 lakh costs = ₹21.6 lakh
- Invested at 10% for 10 years, that becomes about ₹56 lakh
- Monthly EMI is about ₹55,540, versus ₹30,000 rent, so the renter also invests the monthly gap
After 10 years the buyer’s net worth is about ₹97 lakh and the renter’s about ₹1.10 crore. Renting and investing comes out roughly ₹13 lakh ahead. Cut the investment return to 7% and the result flips: buying wins by about ₹8.8 lakh. In India the whole decision turns on what return you genuinely expect to earn, and whether you would actually invest the difference every month. The India calculator lets you test both.
Brazil: double-digit rates make opportunity cost huge
Brazil’s defaults reflect a Selic-driven world: a R$600,000 home, 20% down, a 12% mortgage rate, 6% price growth and an 11% after-tax return on fixed income.
- Upfront cash: R$120,000 deposit + R$24,000 costs = R$144,000
- At 11% for 10 years, that becomes about R$409,000
The buyer ends with about R$562,000 in net worth and the renter about R$1.1 million, a gap of roughly R$536,000 in favour of renting. Even at an 8% return, renting still wins by around R$335,000, because the 12% mortgage rate makes every borrowed real expensive too. When both the mortgage rate and the safe return are high, the opportunity cost of the deposit and the cost of the loan pull in the same direction.
Switzerland: low returns, but a big deposit requirement
Swiss defaults: a CHF 1.2 million home, the 20% minimum equity Swiss rules require, 3% buying costs, a 1.6% mortgage, 2.5% price growth and a 5% investment return.
- Upfront cash: CHF 240,000 + CHF 36,000 = CHF 276,000
- At 5% for 10 years, that becomes about CHF 449,600
Here the outcome is almost exactly a tie after 10 years (buying ahead by under CHF 3,000, breaking even in year 9). Lower the assumed return to 3% and buying wins by about CHF 115,000. Switzerland shows the other side of the coin: when investment returns are modest, the deposit’s opportunity cost is small, and cheap mortgage money does the rest.
Should I put 20% down?
The answer depends on one comparison: your mortgage rate versus your realistic after-tax investment return.
- If the mortgage rate is higher than your return, every extra unit of deposit saves more interest than it would have earned. Put more down.
- If the mortgage rate is lower than your return, every extra unit of deposit earns less than it would elsewhere. Put down the minimum that gets you good loan terms.
Running each market at 10%, 20% and 30% down confirms the pattern:
| Market (10-year horizon) | Mortgage rate | Return assumed | Result at 10% down | 20% down | 30% down |
|---|---|---|---|---|---|
| India | 8.5% | 7% | Buy +₹7.0 lakh | Buy +₹8.8 lakh | Buy +₹10.5 lakh |
| India | 8.5% | 10% | Rent +₹12.0 lakh | Rent +₹13.2 lakh | Rent +₹14.5 lakh |
| Switzerland | 1.6% | 5% | Buy +CHF 47,300 | Buy +CHF 2,900 | Rent +CHF 41,600 |
| United States | 6.3% | 5% | Rent +$2,600 | Buy +$4,600 | Buy +$11,700 |
| United States | 6.3% | 7% | Rent +$38,600 | Rent +$41,400 | Rent +$44,100 |
Read across each row. Where the return assumed is below the mortgage rate (India at 7%, the US at 5%), a bigger deposit improves the buyer’s result. Where the return is above the mortgage rate (Switzerland, India at 10%, the US at 7%), a bigger deposit makes buying look worse.
Note that our model does not add mortgage insurance, which in practice changes the US picture below 20% down.
What the maths leaves out
The pure comparison is a starting point. Several real-world factors can justify a different choice:
- Mortgage insurance and pricing tiers. In the US, PMI usually applies below 20% down. In Canada, CMHC insurance applies below 20%, and in Australia, lenders mortgage insurance usually kicks in below 20%. Lenders also price loans in loan-to-value bands, so 25% down can unlock a noticeably cheaper rate.
- Regulatory minimums. Some markets set the floor for you: Swiss rules require at least 20% equity, Hong Kong lending typically needs a large deposit, and the UAE Central Bank caps expatriate first-home loans at 80% of value up to AED 5 million.
- Liquidity. Cash in a portfolio can pay for a job loss or medical bill; cash in bricks can only be reached by borrowing against it or selling. A smaller deposit with a healthy emergency fund is often more resilient than a large deposit and an empty account.
- Behaviour. Opportunity cost only exists if the money really gets invested. A renter who spends the difference has no investment growth to show for it, which is one reason forced saving through a mortgage works well for many people. Our article on renting and investing vs buying a house looks at this honestly.
- Risk. Investment returns are volatile. Paying down a mortgage earns a certain return equal to its rate.
Down payment vs investing: a quick checklist
- Write down your mortgage rate and your honest after-tax return expectation.
- Add buying costs to the deposit, because that cash is gone too.
- Check the loan-to-value tiers where insurance or rates change.
- Keep six months of expenses outside the house regardless.
- Run your numbers at a lower return (for example, 2 percentage points below your guess) to see if the verdict holds.
- Compare the result with the 5% rule, which builds the cost of equity into a single number.
You can put all of this into one model with our global rent vs buy calculator: change the down payment and the investment return and watch the break-even year move. This is general information, not personal financial advice.
Run your own numbers
Every rule of thumb above depends on your rent, price, rate and how long you stay. Use the Rent and Invest vs Buy Calculator below — it starts with local defaults you can change.